Research results
In this
chapter, the samples taken from the dunes are analysed and projected in the
form of results which will then be discussed and later a conclusion and advice
drawn.
1.1. pH results
The pH of
the soil has been measured by the project group in three different methods as
it described in pH of soil samples section. The results of the
measurements are represented in Table 1 pH results of soil samples.
Table 1 soil pH
|
Sample |
0.01M CaCl2 |
1M KCl |
Demineralized
water |
|
1.1 |
3.09 |
3.1 |
3.73 |
|
1.2 |
4.43 |
4.57 |
5.04 |
|
2.1 |
3.12 |
3.17 |
4.33 |
|
2.2 |
4.65 |
4.71 |
4.73 |
|
3.1 |
4.69 |
4.62 |
4.82 |
|
3.2 |
4.72 |
4.71 |
4.69 |
|
4.1 |
4.06 |
4.22 |
5.08 |
|
4.2 |
4.04 |
4.4 |
4.65 |
|
5.1 |
4.38 |
4.47 |
4.61 |
|
5.2 |
4.66 |
4.72 |
4.81 |
|
6.1 |
3.22 |
3.01 |
4.21 |
|
6.2 |
4.54 |
4.58 |
4.92 |
One of the
first measurements done was analysing the soil pH of the soil samples (Table 1). This is one of the most basic
steps in soil analysis. Three different methods were used and the results show
reasonable numbers without much deviation. All in all the soil pH is quite
acidic ranging from 3-5, there are 3 samples with rather acidic samples with an
approximate pH of 3, which are 1.1; 1.2 and 6.1. It is also worth mentioning
that the samples with decimal ''.1'' is top soil, while decimal ''.2'' is
bottom, this shows that bottom soil tends to be slightly more acidic than the
top soil. From left to right, the table shows three different methods and it is
clearly visible that the pH increases from the CaCL2 method to the
KCL method and increases even further with the demi-water method. Acidic pH is
not a problem, however it depends on what type of vegetation is in demand and
what type of pH it required. In this case the soil is not just slightly acidic,
but in some cases very acidic allowing only low pH requiring grass/plant species
to dominate.
1.2. Nitrogen
kjeldahl
The
Nitrogen Kjeldahl has been performed only once during the project. The samples
were taken from the wet season and measured as it described in the Nitrogen Kjeldahl section. The results are in the Table 2 Nitrogen Kjeldahl results.
Table 2 Nitrogen Kjeldahl results
|
Sample |
N-Kj (mg/Kg) |
|
1.1 |
129.14 |
|
1.2 |
0.98 |
|
2.1 |
75.22 |
|
2.2 |
0.28 |
|
3.1 |
216.68 |
|
3.2 |
7.00 |
|
4.1 |
11.21 |
|
4.2 |
10.51 |
|
5.1 |
0.24 |
|
5.2 |
7.70 |
1.3. Ammonium and nitrate
The
ammonium concentration in the soil has been measure twice in two different
condition. The samples were taken from the dry season when it was not raining
for week on the National Park. The second batch of samples have been taken
during the wet season when it was raining for 5 days in a row on the field. The
location of the sampling points are represented on Figure 9 the sampling points.
1.3.1.
Dry
season
The dry
season samples were taken on 3rd November 2017 from three different
location. Calibration lines have been made in order to be able to determine the
concentration of ammonium and nitrate. The method is described in the
additional lab report and the calibration lines
are in the Calibration line of ammonium and nitrate measurements. The final results of the
measurement is in the Table 3 Ammonium results from dry season and Table 4 Nitrate results from dry season.
Table 3 Ammonium results from dry season
|
Samples |
Absorption |
Concentration
(mg/L) |
|
|
1.1 |
0.414 |
0.90 |
|
|
Groundwater |
0.154 |
0.33 |
|
|
2.1 |
0.586 |
1.27 |
|
|
3.1 |
0.484 |
1.05 |
|
|
3.2 |
0.262 |
0.57 |
|
Table 4 Nitrate results from dry season
|
Samples |
Absorption |
Concentration
(mg/L) |
|
1.1 |
0.003 |
1.58 |
|
GW |
0.01 |
5.26 |
|
2.1 |
0.004 |
2.10 |
|
3.1 |
0.002 |
1.05 |
|
3.2 |
0.004 |
2.10 |
1.3.2.
Wet
season
The wet
season samples were taken on 7th December 2017 from six different
location. Calibration lines have been made in order to be able to determine the
concentration of ammonium and nitrate. The method is described in additional
lab report and the calibration lines are in Calibration line of
ammonium and nitrate measurements. The final results of the
measurement is in the Table 5 Ammonium results from wet season and Table 6 Nitrate results from wet season.
Table 5 Ammonium results from wet season
|
Samples |
Absorption |
Concentration
(mg/L) |
|
1.1 |
2.47 |
4.45 |
|
1.2 |
1.204 |
2.17 |
|
2.1 |
1.604 |
2.89 |
|
2.2 |
0.454 |
0.82 |
|
3.1 |
0.551 |
0.99 |
|
3.2 |
0.496 |
0.89 |
|
4.1 |
0.411 |
0.74 |
|
4.2 |
0.382 |
0.69 |
|
5.1 |
0.494 |
0.89 |
|
5.2 |
0.433 |
0.78 |
|
6.1 |
1.427 |
2.57 |
|
6.2 |
0.525 |
0.95 |
|
Rain water |
2.191 |
3.95 |
|
|
|
|
Table 7 Nitrate results from wet season
|
Samples |
Absorption |
Concentration
(mg/L) |
|
1.1 |
0.009 |
0.3812 |
|
1.2 |
0.006 |
0.2541 |
|
2.1 |
0.007 |
0.2965 |
|
2.2 |
0.027 |
1.1436 |
|
3.1 |
0.002 |
0.0847 |
|
3.2 |
0.001 |
0.0424 |
|
4.1 |
0.002 |
0.0847 |
|
4.2 |
0.819 |
34.6879 |
|
5.1 |
0.003 |
0.1271 |
|
5.2 |
0.012 |
0.5082 |
|
6.1 |
0.012 |
0.5082 |
|
6.2 |
0 |
0.0000 |
|
Rain water |
0.013 |
0.5506 |
1.3.3.
Maps
with Laboratory results
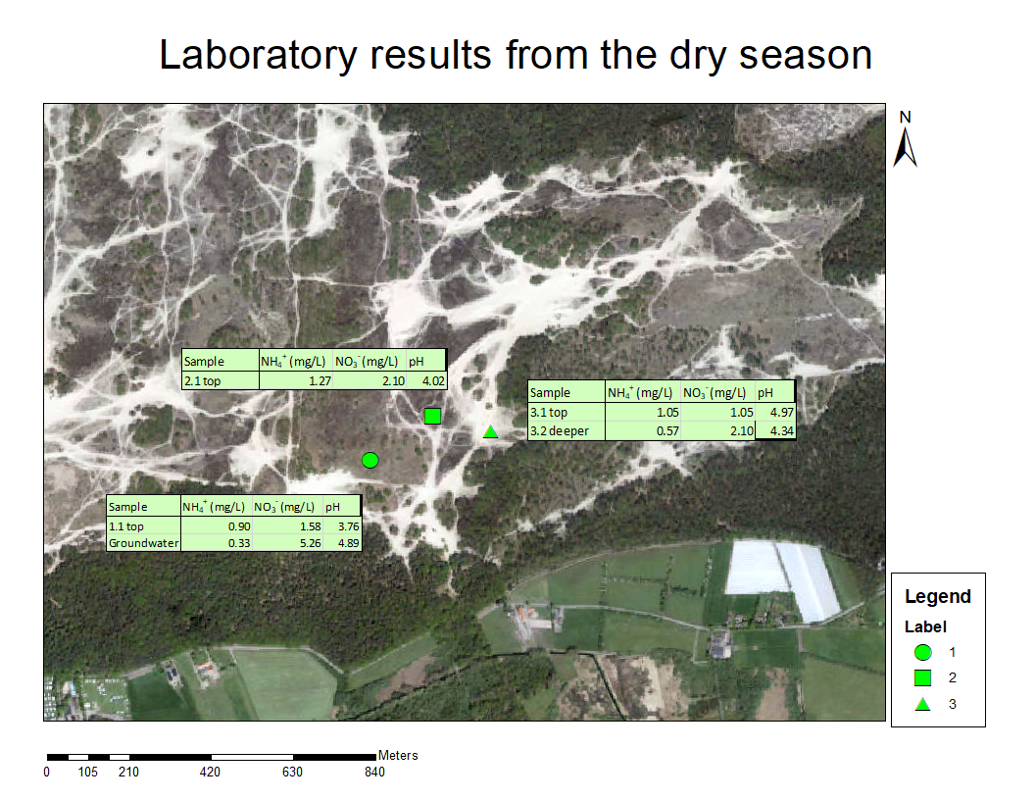
The
following maps (Figure 1 and Figure 2) show the sampling points for the
wet and dry seasons of the ammonium and the nitrate concentrations in the soil
respectively. The marks on the map show the location of where the samples were
taken. The marks with a black dot inside them are the areas used by last year’s
project group.
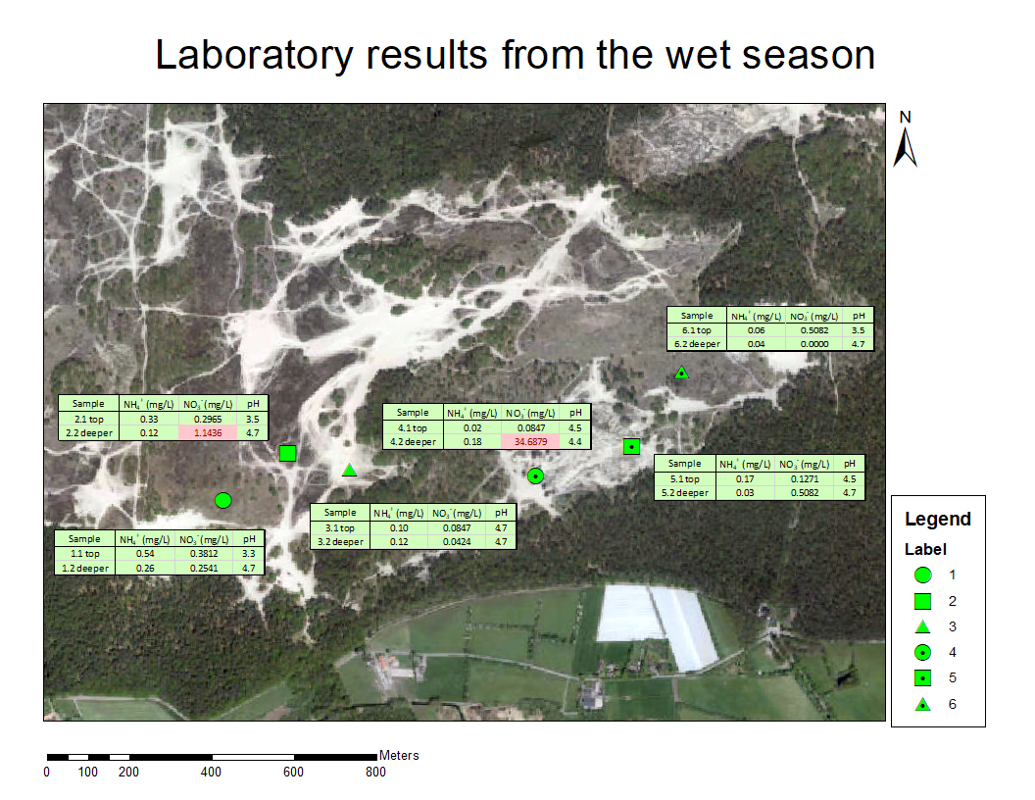 Figure 1 Map with laboratory results regarding Ammonium and Nitrate during wet season
|
1.4. GIS
In this
chapter the results from the GIS will be presented. These maps are all located
in the area of study inside the National park the Loon and Drunen Dunes.
1.4.1.
Classification
maps
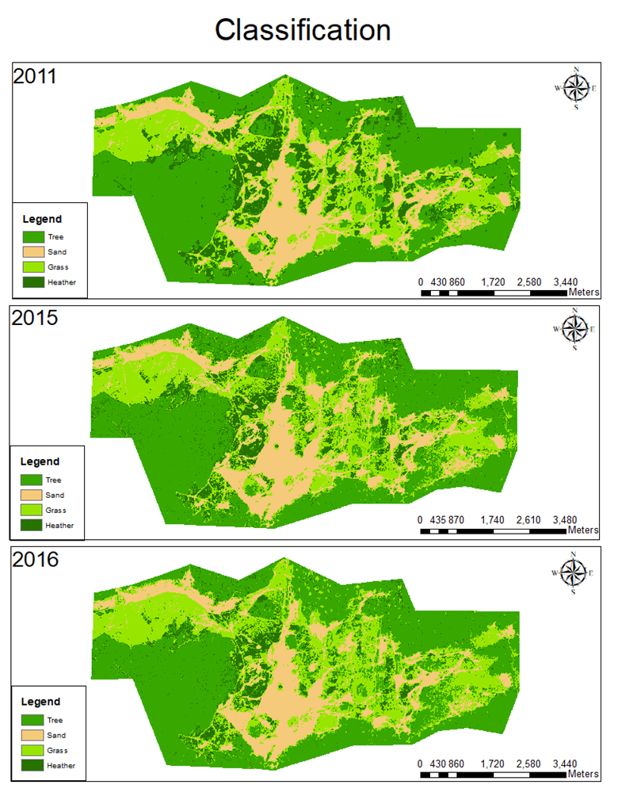
Figure 3 classification map 2011, 2015 and 2016 shows a comparison between satellite images of the
National Park the Loon and Drunen Dunes and a classification map. The
classification map was made by the project group in order to visualize the
important areas regarding succession, in order to do so a time span of over
three years has been looked at and compared. Each of these maps displays the
entire area of trees, sand, grass and heather and since there are more than
three variables, two colours were used in order make it less confusing. The
vegetation (trees, grass and heather) is shown in different shades of green and
the sand is cream colour and this was done for the year 2011, 2015 and 2016.
When comparing these three years it is indeed possible to make a correlation
with succession.
|
|
|
Figure 3 classification map 2011,15.16 |
Figure 4 Vegetation changes in
the last three years shows the percentage of tree,
grass, heather and sand, which is on the y-axis while the x-axis shows the
three time period of each variable. Based on this graph it is possible to see
that the percentage slightly raised over time. More interestingly it is
possible to see that the amount of heather has been steadily declining over the
years.
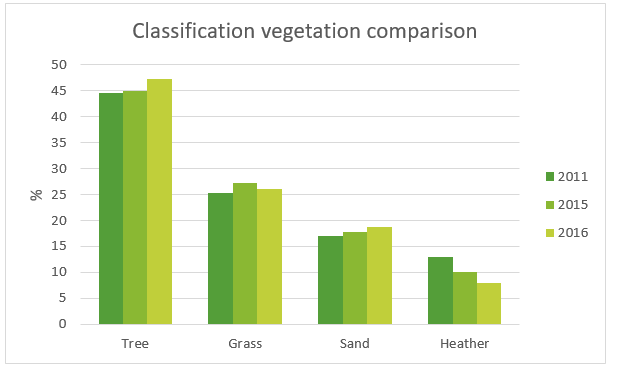
Figure 4 Vegetation changes in the last three years
1.4.2.
Classification
of the drone pictures
The stitched drone pictures were
also classified thus, the project groups in the following years will be able to
compare it in the future. The GIS layer has been also delivered to the RIVM
client.
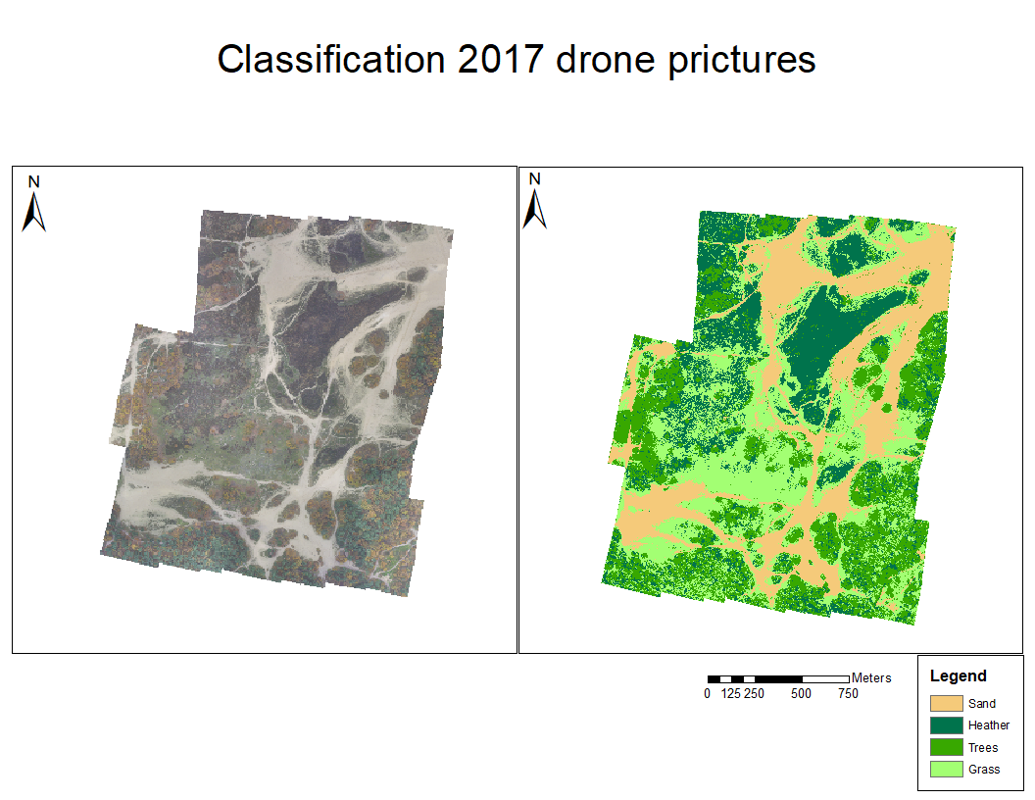
|
Figure 5 Stitched
drone pictures and classified map from 2017 |